Food order forecast by RandomForestRegressor, DecisionTreeRegressor, LinearRegression

 refer to code:


.

from sklearn.metrics import r2_score,mean_squared_error
from sklearn.ensemble import RandomForestRegressor
from sklearn.tree import DecisionTreeRegressor
from sklearn.linear_model import LinearRegression
from sklearn.model_selection import train_test_split
import matplotlib.pyplot as plt
import seaborn as sns
from math import sqrt
import numpy as np
import pandas as pd
import warnings
warnings.filterwarnings('ignore')

features = pd.read_csv('./features.csv')
label = pd.read_csv('./label.csv')

features.head()
label.head()

#------------------------------------ data split ---------------------------------------------
X_train,X_test,y_train,y_test = train_test_split(features,label,test_size=0.20,random_state=33)

#------------------------------------ RandomForestRegressor ---------------------------------------------
RFRmodel = RandomForestRegressor(max_depth=3, random_state=0)
RFRmodel.fit(X_train,y_train)
y_pred = RFRmodel.predict(X_test)

print('RandomForestRegressor')
print("R2 score :",r2_score(y_test, y_pred))
print("MSE score :",mean_squared_error(y_test, y_pred))
print("RMSE: ",sqrt(mean_squared_error(y_test, y_pred)))
print('')

#------------------------------------ DecisionTreeRegressor---------------------------------------------
DTRmodel = DecisionTreeRegressor(max_depth=3,random_state=0)
DTRmodel.fit(X_train,y_train)
y_pred = DTRmodel.predict(X_test)

print('DecisionTreeRegressor')
print("R2 score :",r2_score(y_test, y_pred))
print("MSE score :",mean_squared_error(y_test, y_pred))
print("RMSE: ",sqrt(mean_squared_error(y_test, y_pred)))
print('')

#------------------------------------ LinearRegression ---------------------------------------------
model = LinearRegression()
model.fit(X_train,y_train)
y_pred = model.predict(X_test)

print('LinearRegression')
print("R2 score :",r2_score(y_test, y_pred))
print("MSE score :",mean_squared_error(y_test, y_pred))
print("RMSE: ",sqrt(mean_squared_error(y_test, y_pred)))
print('')


..


You can download dataset from here:

https://www.marearts.com/Tea-Time-Computer-Vision-6bc925c53d46412691096825bfe0317a?p=004ca41eee0948c49f979016b6a31de8&pm=s


Thank you.

www.marearts.com

🙇🏻‍♂️

example source code of python for converting numpy ndarray to pandas dataframe

 refer to code:


.

import numpy as np
import pandas as pd

# Create a numpy ndarray
array = np.random.rand(5, 3)
print('array: \n', array)

# Convert the numpy ndarray to a pandas DataFrame
df = pd.DataFrame(array, columns=['Column1', 'Column2', 'Column3'])

# Print the DataFrame
print('df: \n',df)

..


Thank you.

www.marearts.com

🙇🏻‍♂️

The AttributeError: 'Series' object has no attribute 'to_list'


The error occurs when you try to call the to_list() method on a pandas Series object, but the method is not available in the version of pandas you are using. This method was added in pandas version 0.24.0, so if you are using an earlier version of pandas, you will get this error.

To fix this error, you can either upgrade your pandas version to 0.24.0 or later, or you can use an alternative method to convert the Series object to a list. Here are some examples:

  1. Using the tolist() method: If you are using pandas version 0.17.0 or later, you can use the tolist() method instead of to_list(). For example:

.

import pandas as pd

# Create a pandas Series object
s = pd.Series([1, 2, 3, 4, 5])

# Convert the Series object to a list
lst = s.tolist()

print(lst)
# Output: [1, 2, 3, 4, 5]

..


  1. Using the values attribute: If you are using pandas version 0.24.0 or later, you can also use the values attribute to get a numpy array, and then convert the array to a list using the tolist() method. For example:
.
import pandas as pd

# Create a pandas Series object
s = pd.Series([1, 2, 3, 4, 5])

# Convert the Series object to a list
lst = s.values.tolist()

print(lst)
# Output: [1, 2, 3, 4, 5]
..


  1. Using the list() function: If you are using an earlier version of pandas and the above methods do not work, you can use the built-in list() function to convert the Series object to a list. For example:
.
import pandas as pd

# Create a pandas Series object
s = pd.Series([1, 2, 3, 4, 5])

# Convert the Series object to a list
lst = list(s)

print(lst)
# Output: [1, 2, 3, 4, 5]
..


Thank you.
www.marearts.com
🙇🏻‍♂️

python, pandas, to create empty data frame with same header from other df.


refer to code.

..

import pandas as pd
data_df = pd.read_csv('train_data.tsv', delimiter='\t')
col = list(data_df.columns)

#make empty pandas with same header
empty_df = pd.DataFrame(columns=col)
print(empty_df)

..


Thank you.

www.marearts.com

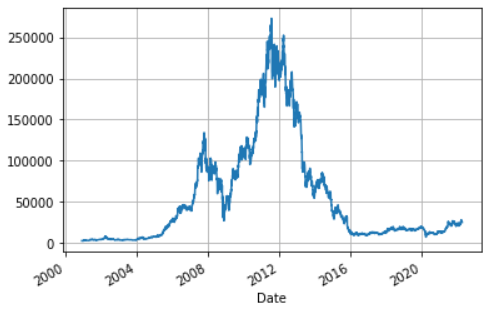
Get google stock date using pandas.


refer to sample code

..

import datetime
import pandas_datareader.data as pdr
# We will look at stock prices over the past year, starting at January 1, 2016
start = (2000, 12, 1)
start = datetime.datetime(*start)
end = datetime.date.today()

google = pdr.DataReader('028050.KS', 'yahoo', start, end)
google.Low.plot(grid=True)

..


Thank you.

www.marearts.com

pandas moving average


Average by 2 steps moving window

.

import pandas as pd
data=[100, 200, 100, 100, 200, 100]
df = pd.DataFrame(data)
df.rolling(2).mean()

.

    0
0 NaN
1 150.0
2 150.0
3 100.0
4 150.0
5 150.0


www.marearts.com
🙇🏻‍♂️

pandas pct_change(), function to find the percentage change in the time-series data.

 The rate of change between the previous data and the current data

.

import pandas as pd
data=[100, 200, 100, 100, 200, 100]
df = pd.DataFrame(data)
df.pct_change()

.

     0
0 NaN
1 1.0
2 -0.5
3 0.0
4 1.0
5 -0.5


www.marearts.com
🙇🏻‍♂️

pandas replace zeros with previous non zero value


Here, our example data is stock csv file.


Load data and print 

.

import pandas as pd
IBM_path = 'IBM-practice.csv'
df = pd.read_csv(IBM_path, delimiter=',', usecols=['Date', 'Open', 'High', 'Low', 'Close', 'Volume'])
print(df)

.

         Date        Open        High         Low       Close    Volume

0  2021-01-19  123.594643  123.891014  122.456978  123.346077   5646308

1  2021-01-20  123.996178  125.296364  122.906311  124.359467        10

2  2021-01-21  124.397705  126.424477  124.330788  125.860420         0

3  2021-01-22  115.391968  115.391968  112.198853  113.393883  39814421

4  2021-01-25  113.537285  114.282982  112.284897  113.365204  14315974

5  2021-01-26  113.938812  117.198853  113.212234  117.103249  11186656


replace zeros with previous non zero value & check

.

# Replace 0 to avoid dividing by 0 later on
df['Volume'].replace(to_replace=0, method='ffill', inplace=True)
print(df)

.

         Date        Open        High         Low       Close    Volume

0  2021-01-19  123.594643  123.891014  122.456978  123.346077   5646308

1  2021-01-20  123.996178  125.296364  122.906311  124.359467        10

2  2021-01-21  124.397705  126.424477  124.330788  125.860420        10

3  2021-01-22  115.391968  115.391968  112.198853  113.393883  39814421

4  2021-01-25  113.537285  114.282982  112.284897  113.365204  14315974

5  2021-01-26  113.938812  117.198853  113.212234  117.103249  11186656


Thank you.

www.marearts.com

🙇🏻‍♂️


python pandas, shuffle

refer to example code:


from sklearn.utils import shuffle
import pandas as pd

df = pd.read_csv('test.csv')
df = shuffle(df) #suffle
df.reset_index(drop=True) #index reset
df.to_csv('rfine_table_shuffle.csv', index=False)

search column name and modify data, python pandas usages


Above all,
Let's make initial column head.

import pandas as pd
#init
col_names = ['product', 'count']
word_pd = pd.DataFrame(columns = col_names)


There is no data yet.
So, let's add initial data

#add produce list
word_pd.loc[len(word_pd)] = ['apple', 4]
word_pd.loc[len(word_pd)] = ['orange', 7]
word_pd.loc[len(word_pd)] = ['beer', 10]
word_pd.loc[len(word_pd)] = ['cola', 7]
word_pd.loc[len(word_pd)] = ['beer', 8]

#check
print('origin data', word_pd)

>
origin data   product count
0   apple     4
1  orange     7
2    beer    10
3    cola     7
4    beer     8


OK, then let's find specific product name and increase count.

#find product
list_pd = word_pd.loc[word_pd['product'] == 'apple']
list_f = list_pd.index.tolist()

#add count
if len(list_f)>0:
for index in list_f:
word_pd.iloc[index][1] = word_pd.iloc[index, word_pd.columns.get_loc('count')] +1

print('result')
print('data', word_pd)

>
result
data   product count
0   apple     5
1  orange     7
2    beer    10
3    cola     7
4    beer     8


OK, at this time, let's find beer product and add count.
Note, there are 2 rows of beer product, so all beer product's count are increased.
#one more test
#find product
list_pd = word_pd.loc[word_pd['product'] == 'beer']
list_f = list_pd.index.tolist()


#add count
if len(list_f)>0:
for index in list_f:
word_pd.iloc[index][1] = word_pd.iloc[index, word_pd.columns.get_loc('count')] +1

print('result')
print('data', word_pd)


result
data   product count
0   apple     5
1  orange     7
2    beer    11
3    cola     7
4    beer     9


This is whole source code.

import pandas as pd
#init
col_names = ['product', 'count']
word_pd = pd.DataFrame(columns = col_names)

#add produce list
word_pd.loc[len(word_pd)] = ['apple', 4]
word_pd.loc[len(word_pd)] = ['orange', 7]
word_pd.loc[len(word_pd)] = ['beer', 10]
word_pd.loc[len(word_pd)] = ['cola', 7]
word_pd.loc[len(word_pd)] = ['beer', 8]

#check
print('origin data', word_pd)

#find product
list_pd = word_pd.loc[word_pd['product'] == 'apple']
list_f = list_pd.index.tolist()

#add count
if len(list_f)>0:
for index in list_f:
word_pd.iloc[index][1] = word_pd.iloc[index, word_pd.columns.get_loc('count')] +1

print('result')
print('data', word_pd)

#one more test
#find product
list_pd = word_pd.loc[word_pd['product'] == 'beer']
list_f = list_pd.index.tolist()


#add count
if len(list_f)>0:
for index in list_f:
word_pd.iloc[index][1] = word_pd.iloc[index, word_pd.columns.get_loc('count')] +1

print('result')
print('data', word_pd)


Thank you.


Pandas simple tip

import pandas

read csv file without header
df = pandas.read_csv('./train.csv', header=None, index_col=False)
print(df)

                0     1     2     3     4      5
0    0101_003.png   770   946  2070  2973  table
1    0110_099.png   270  1653  2280  2580  table
2    0113_013.png   303   343  2273  2953  table
3    0140_007.png   664  1782  1814  2076  table
4    0146_281.png   704   432  1744  1552  table
5    0146_281.png   682  1740  1800  2440  table
6    0147_090.png   326   413  2106  1616  table
7    0147_090.png   760  1843  1643  2393  table
8    0147_125.png   310   338  2310   912  table
9    0147_125.png   754  1184  1798  1514  table
10   0147_256.png   590   366  1940  1520  table
..            ...   ...   ...   ...   ...    ...
410  9529_050.png   104  2234  2040  2512  table
411  9530_051.png    90   470  2394  1682  table
412  9531_070.png   166   368  2328  1088  table
413  9531_070.png   148  1100  2340  1788  table
414  9531_073.png    50   260  2336  2876  table
415  9532_146.png   563   490  2440  2853  table
416  9533_038.png  1278   454  2326  1358  table
417  9533_038.png  1270  1774  2328  2368  table

[418 rows x 6 columns]

several way to read first column
print(df[0].tolist())
print(df.values.tolist()[:][0])
print(df.iloc[:,0].values.tolist())

['0101_003.png', '0110_099.png', '0113_013.png', '0140_007.png', '0146_281.png', '0146_281.png', '0147_090.png', '0147_090.png', '0147_125.png', '0147_125.png', '0147_256.png', '0147_256.png', '0148_271.png', '0148_479.png', '0151_180.png', '0151_208.png', '0154_080.png', '0154_474.png', '0155_081.png', '0199_384.png', '0203_075.png', '0206_007.png', '0206_048.png',
...
'9522_041.png', '9522_055.png', '9522_055.png', '9525_037.png', '9525_043.png', '9525_043.png', '9525_043.png', '9526_017.png', '9526_028.png', '9526_028.png', '9526_028.png', '9527_018.png', '9527_024.png', '9527_024.png', '9528_043.png', '9528_043.png', '9528_061.png', '9528_061.png', '9528_061.png', '9529_050.png', '9529_050.png', '9529_050.png', '9530_051.png', '9531_070.png', '9531_070.png', '9531_073.png', '9532_146.png', '9533_038.png', '9533_038.png']

pandas for each row
for index, row in df.iterrows():
print(index, row[0], row[1])

0 0101_003.png 770
1 0110_099.png 270
2 0113_013.png 303
3 0140_007.png 664
4 0146_281.png 704
5 0146_281.png 682
6 0147_090.png 326
7 0147_090.png 760
8 0147_125.png 310
9 0147_125.png 754
10 0147_256.png 590
11 0147_256.png 368
...


python numpy to CSV, numpy to pandas, pandas to CSV

Sample code for
- numpy to CSV
- numpy to pandas
- pandas to CSV


import numpy as np
import pandas as pd

f1_numpy = "./data/test1.csv"
f2_pandas = "./data/test2.csv"

#numpy to csv
np.savetxt(f1_numpy, np.array([10,20]))
print(f1_numpy)

#numpy to pandas and csv
pda = pd.DataFrame(np.array([10,20]), columns=['data'])
pda.to_csv(f2_pandas, index=False)

Thank you.

3D array numpy -> pandas ->csv -> pandas -> 3d array numpy

This article is example source code for
3D array numpy -> pandas -> csv -> pandas -> 3D array numpy

Let's see step by step


Step 1, make example data

import numpy as np
import pandas as pd


#make list
a = [[11, 12, 13, 14, 15], [15, 16, 17, 18, 19]]
b = [[21, 22, 23, 24, 25], [25, 26, 27, 28, 29]]
c = []
c.append(a)
c.append(b)
#make numpy
npa = np.array(c)
print('npa\n',npa)
print('npa shape\n',npa.shape) #2 by 2 by 5


result
npa
 [[[11 12 13 14 15]
  [15 16 17 18 19]]

 [[21 22 23 24 25]
  [25 26 27 28 29]]]
npa shape
 (2, 2, 5)


Step 2, numpy to pandas
#make numpy to panda
m,n,r = npa.shape
#numpy ->group indexing, reshape
out_arr = np.column_stack((np.repeat(np.arange(m),n),npa.reshape(m*n,-1)))
out_df = pd.DataFrame(out_arr, columns=['group','a','b','c','d','e'])
print('pnadas\n',out_df) #pandas

result

group   a   b   c   d   e
0      0  11  12  13  14  15
1      0  15  16  17  18  19
2      1  21  22  23  24  25
3      1  25  26  27  28  29


Step 3, save csv, load csv

#save to csv
out_df.to_csv('test3Dpandas.csv', index=False)
#load csv
df = pd.read_csv('test3Dpandas.csv')


Step 4, pandas to numpy

#pandas to numpy
npb = df.values
npb = npb[:,1:]
npb2 = npb.reshape(m,n,r)
print('numpy\n',npb2)

result

numpy
 [[[11 12 13 14 15]
  [15 16 17 18 19]]

 [[21 22 23 24 25]
  [25 26 27 28 29]]]